Out-of-the-box Salesforce reports and dashboards are great tools to analyze summary transactional data, such as donations, advocacy actions, outreach efforts, and constituent cases. Salesforce ‘Reporting Snapshots’, however, let’s you take trend analysis to a whole new level.
“Reporting Snapshots” (previously known as “analytic snapshots”) allow you to automatically capture periodic point-in-time summaries, across various types of data, to deliver trend and point-in-time comparative analysis to your staff that’s not available with standard reporting.
As background, the standard summary reports and dashboards in Salesforce that are based on time-specific summaries can be easily created when you’re reporting on a single object and have a specific date field on the record on which to base the summary. For example, standard Salesforce supports a summary report of donations received (count and $ amount) by month, quarter, etc. This is a straightforward summary report of donations (opportunities) summarized using the donations’ received date field.
But, what if you want to report on trends or do point-in-time comparative analysis in situations such as the following:
1. You want trending or point-in-time comparisons where there isn’t a specific date field on records off of which to key. For example, how many ‘active’, ‘lapsed’, and ‘expired’ members did you have at the beginning of each month? How many major donor prospects did you have at the beginning of each month? How many total cases in an open status did you have the end of each work week?
As you can see, these are data points that are based on a “snapshot” of your Salesforce records at a particular point in time (i.e., count or summary amount at the end of each week, month, quarter, etc.), rather than on data that is on the record itself. To compare this kind of information or analyze this trend over time requires more than just a standard Salesforce report.
2. You want to pull summary information, for a specific point in time, that combines data from more than one object. For example, it might be helpful to get a monthly snapshot that includes your total member count and total number of open cases so you could analyze trending of those two variables over time and even see if there’s any correlation between how one impacts the other.
If you were able to capture snapshot records in a single custom object that included summary details on both membership and cases, you could then could easily generate reports and dashboards to analyze that data any which way you want. That’s what ‘Reporting Snapshots’ allows you to do.
Best news? ‘Reporting Snapshots’ doesn’t require any code or another app download. It is a simple matter of configuration by the Salesforce admin. Here’s how:
- Configure one or more custom summary reports;
- Configure a new custom object with a field for each of the summary points you wish to capture from the report;
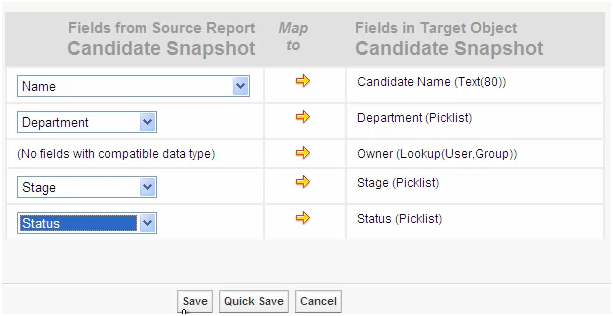
- Under Data Management > Reporting Snapshots, map summary values from your custom report to fields in your custom object; and;
- Schedule your custom report to run automatically – this will create a new record in your custom object each time the scheduled report runs.

Here’s step-by-step of a simple example of capturing a count of open cases at the end of each work week:
- Create a summary report of open cases;
- Create a custom object with a date field and number field (# Open Cases);
- Create a Snapshot Report that maps the report to the custom object’s field, then schedule to run each week;
- If you want to capture membership counts for each week, you could do the same thing and map to a different number field (# Members) in that same custom object;
- Once the reports start generating these weekly records, you’ll be able to easily create reports and dashboards on that custom object to view weekly trending of your point-in-time data.
‘Reporting Snapshots’ will take your reporting to new levels and new insights. For more information on preparing ‘Reporting Snapshots,’ please visit this Salesforce help article: http://bit.ly/reportingsnapshots.


