Adapting metrics to show mission progress
In today’s environment, organizations of every shape and size are being pushed to leverage data, optimize operations, and improve against metrics. The challenge for mission-driven organizations, like academic and research institutions, is that many performance metrics from the commercial sector fail to account for progressing mission. This does not mean that the performance of mission-driven institutions cannot or should not be measured. In fact, measuring the performance of these organization can be straightforward by simply adapting common metrics. For example, we have found density metrics, which track the output or measurement of an activity over a key resource, to be a powerful way to assess performance at mission-driven institutions.
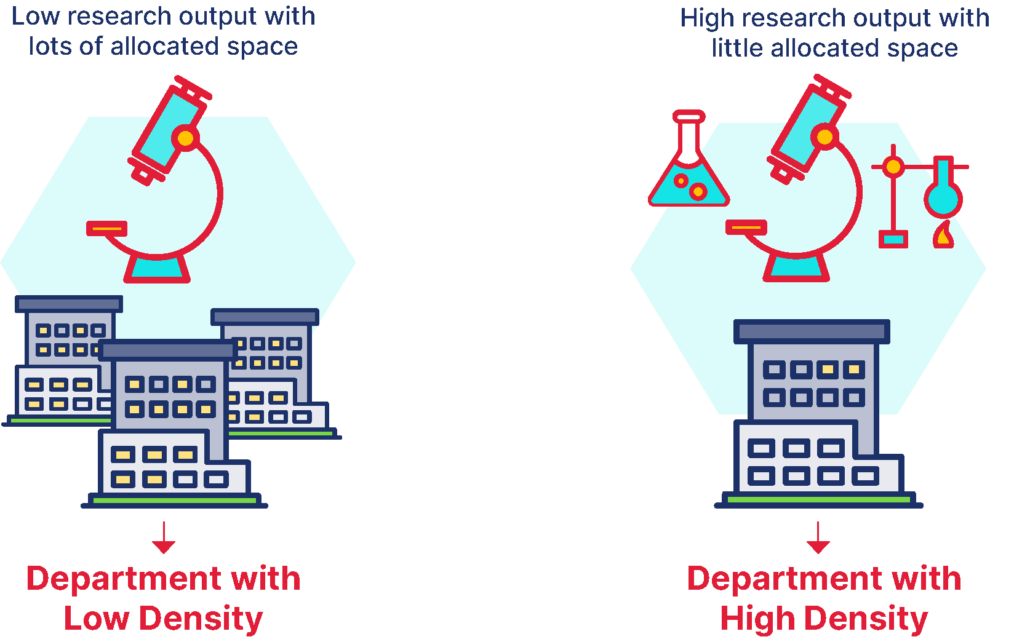
Research Density—Measuring the output from physical space in an institution
In this post, we will discuss research density, however, the methodology and insights apply to a variety of other areas beyond research. Research density metrics measure the quantity of research (generally measured in dollars), per unit of space (generally measured in assignable square feet). These metrics are especially important for academic and research institutions because physical space is often one of the largest and most coveted assets of the institution.
Furthermore, over the past 40+ years, virtually every research institution or organization with which we have worked has indicated that space has been at an absolute premium. This trend of demand for space greatly exceeding supply has only increased as budgets have tightened and both institutions and departments are being asked to do more with less.
Use Proxies to Estimate Activity
Research as an abstract concept is impossible to measure directly; therefore, we must select a proxy to indirectly measure research. Some common proxies include:
- Expense (Total, MTDC, Recovery)
- Number of Grants or Projects
- Number of Peer-Reviewed Papers Published
The proxy best for a given institution will vary based on availability and quality of data and the desired use of the metric. For example, institutions interested in improving on non-financial outcomes, such as prestige or quality, might use peer reviewed papers in certain journal, whereas institutions interested in improving indirect cost rates or recovery would focus on expense proxies. For most institutions, we recommend using a least one metric based on expense. We generally find that the accounting system is the most reliably accurate of any systems of record at an institution. Further, based on the detailed attributions in most accounting systems, this data will likely be the easiest to connect with other systems of record. For example, while a space system might only track assignment of space at a college/division and program levels and a grants system might focus on the department and staff levels, an accounting system will generally be able to roll up to any of these levels.
Beyond the quality of the data available, expense data enable leadership within an institution to create multiple metrics that value various type of activities differently. For example, a metric tracking indirect cost recovery (IDC) provides a higher weight to grants at the full indirect rate, which helps to offset the investment in research from an institution, whereas a metric tracking modified total direct cost (MTDC) provides a straight weight to any research activity happening onsite at the institution.
Research Density Metrics from Proxies
Based on the reasons mentioned above, for the rest of this article, we will focus on the expense proxy. Fundamentally, calculating the research density for a given unit once an expense proxy has been selected is relatively straightforward from a procedural perspective: you simply divide the expenses by the assignable square footage (ASF). In most cases, ASF is calculated by taking the total area of a given set of space and reducing that amount by the vacant and unassignable space within that set of space. The goal of this is to quantify the research output from usable assigned space. We will have a whole post dedicated to this topic coming soon, but for those that are interested in the specific formula, here it is:

An example of calculating research density at a particular unit would be dividing the MTDC expense for the chemistry department in 2020 by the area of any buildings or rooms assigned to the chemistry department less any vacant or unassignable space within those buildings or rooms.

Measure and Communicate Performance
Today’s environment presents mission-driven institutions with the opportunity to demonstrate that they are able to do more with less. By creating and communicating performance metrics, these institutions can easily show where they are achieving on those opportunities and where there is room to grow. This is always best accomplished by implementing a robust system and associated processes for calculating, monitoring, and reviewing these performance metrics. These systems can be based on powerful purpose-built SaaS products, like Attain Research Performance, or in some cases, even basic Excel models and PowerPoint presentations. This will enable leadership and high performing areas of the institutions to clearly show their impact to the institution and mission, which can be used as a basis for additional investment.
Want to Learn More?
For the next post in this series, we’ll discuss the step-by-step process to calculating research density using an expense proxy. In the meantime, if you’re interested in learning more or seeing what a research density product would look like for your institution, please contact us here or reach out to the authors below.
As creators of the Attain Apps platform, a SaaS product line focused on academic and research institutions, we are passionate about enterprise performance and metrics and always enjoy sharing, learning, and collaborating with customers.
About the Authors
Sander Altman

Sander Altman is the Chief Architect for the Product and Innovation business at Attain Partners. As the technical leader behind Attain Apps since its formation in 2017, Sander has extensive experience with the technology empowering the platform, as well as a developed understanding of the subject matter covered by the various products within the platform. With a background in AI and Intelligent Systems, as well as an M.S. and a B.S. in Computer Science, Sander has focused on providing institutions with intelligent and easy-to-use software to optimize their academic and research enterprises.

Alexander Brown
Alexander Brown is the Practice Leader for the Product and Innovation business at Attain Partners. Alex is responsible for the full product lifecycle of the Attain Apps product line, which features the firm’s cornerstone intellectual properties distilled into easy-to-use SaaS products. With a background in economics, and experience as a designer, developer, and consultant himself, Alex works hand-in-hand with experts and developers to create products that provide academic and research institutions with best practices and insights in an affordable and convenient package.


